

When your computer suddenly starts loading slowly, freezing, or stuttering, the culprit is almost always a specific application competing for system resources. Windows 11 runs dozens of background routines alongside your favorite programs, and one of them can quietly consume your processor, memory, or disk bandwidth. Identifying that exact routine takes only a few minutes and requires no third-party software.
Before You Start: Close any open applications that you do not need right now. This action reduces background noise and makes it easier to spot the true resource hogs. Keep this guide open in a separate browser tab so you can follow the steps without switching windows.
Step 1: Open Task Manager
- Press
Ctrl + Shift + Escon your keyboard. This keyboard shortcut launches Task Manager immediately without navigating through menus. You will see a compact window showing only your active applications. If you prefer the detailed view, click More details at the bottom left. - Verify that the Processes tab is selected. This tab sits at the top of the window and displays a list of every running program and background process. The columns on the right show CPU, Memory, Disk, and GPU usage percentages. If the window opens to the Details tab instead, click the Processes tab to switch views.
Step 2: Sort Processes by Resource Usage
- Click the CPU column header to sort by processor usage. Windows arranges the list so the highest percentage sits at the top. Look for any single application consistently hovering above 50 percent while you are not actively using it. If the list does not sort automatically, click the header again to toggle between ascending and descending order.
- Repeat the sort for Memory, Disk, and GPU columns. Different slowdowns stem from different bottlenecks. A game might max out your GPU, while a cloud sync tool could saturate your disk drive. Note the names of any processes that remain high even when you are idle.
Step 3: Inspect Background Processes
- Scroll down to the Background processes section. Task Manager groups less visible services and updater routines here. These routines often run silently and consume resources without your knowledge. Click the small arrow next to the section header to expand the list and reveal every hidden routine.
- Right-click a suspicious entry and select End task. Windows will terminate that specific process immediately. You will notice the usage percentage drop in the corresponding column. If the app restarts automatically, it likely has a scheduled task or startup permission that you will need to disable later.
Step 4: Run Resource Monitor for Deeper Analysis
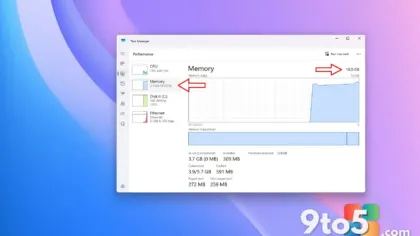
- Click the Performance tab at the top of Task Manager. This view shifts from a process list to live hardware graphs showing real-time utilization. You will see circular gauges for CPU, Memory, Disk, and Network, along with a history graph below each one. The bottom of this tab contains a link labeled Open Resource Monitor.
- Navigate to the CPU tab inside Resource Monitor. This dedicated dashboard breaks down exactly which executables are competing for processor time. You can type a process name into the search box to isolate it from the rest of the list. If the graphs appear flat, click the refresh icon at the top to force a new data sample.
Step 5: Disable Unnecessary Startup Apps
- Open Settings and navigate to
System > Startup. This section controls which programs launch automatically when you sign in. Each entry shows a toggle switch and a measured impact on boot time. Flip the switch to Off for any application that does not need to run immediately. - Restart your PC to apply the changes. Windows will reload your session without the disabled routines. You should notice faster boot times and lower baseline resource consumption. If a critical tool stops working after the restart, return to this menu and re-enable it.
Troubleshooting: Common Issues & Fixes
- Task Manager refuses to open or shows a blank screen. This usually indicates a corrupted system file or a conflicting security scan. Run
sfc /scannowin an elevated Command Prompt to repair protected Windows files. If the issue persists, create a new local user account to test whether the problem follows your profile. - A high-usage process has no recognizable name. Windows sometimes lists background services by their executable file name rather than the app name. Right-click the entry and choose Open file location to see which folder launched it. If the folder points to
C:\Windows\System32, leave it alone, as it is a core system component. - Resource usage drops to zero after a few minutes. Windows throttles background activity to preserve battery life on laptops. Open
Settings > System > Power & batteryand switch your power mode to Best performance. This adjustment tells the operating system to stop capping background routines. - The Performance tab shows identical numbers across all hardware. Your graphics driver or telemetry service might be stuck. Press
Win + Xand select Device Manager. Expand Display adapters, right-click your GPU, and choose Uninstall device. Restart your PC to let Windows reinstall the driver automatically.
Pro Tip: Pin Task Manager to your taskbar for instant access. Right-click the Task Manager icon in the Start menu, select More, and choose Pin to taskbar. You can now press Ctrl + Shift + Esc and immediately jump to your preferred tab without searching through menus.
Identifying the exact application draining your system resources takes a few minutes, but the payoff is immediate. Once you know which routine is causing the bottleneck, you can disable it, update it, or replace it with a lighter alternative. Keep this guide bookmarked so you can revisit the steps whenever your Windows 11 PC starts feeling sluggish again. Which background app surprised you the most when you finally checked your resource usage?
Over to you: Which background app surprised you the most when you finally checked your resource usage?